
The era when what producet was automatically sold is gone. Today, only those capable of fully enforcing single-item control to maintain an appropriate inventory in accordance with actual demand can win in the market.
While looking for a solution based on the concept that “the volume of inventory shows organization’s true strengths”, Okura Industrial Co., Ltd. (hereafter, Okura Industrial) discovered “SynCAS PSI Visualizer” provided by Hitachi Solutions East Japan. It “visualizes” the inventory not only by category, but also by individual items through drilling down whenever in doubt. Furthermore, it provides support for solution planning. Okura Industrial started using “SynCAS PSI Visualizer” in January 2011. Two months later, in March, they started seeing some reduction in their inventory, managing to reduce it by 20% in six months. Nowadays, they give “SynCAS PSI Visualizer” full marks, regarding it as “the speedometer for safe driving by keeping the appropriate volume of inventory”.

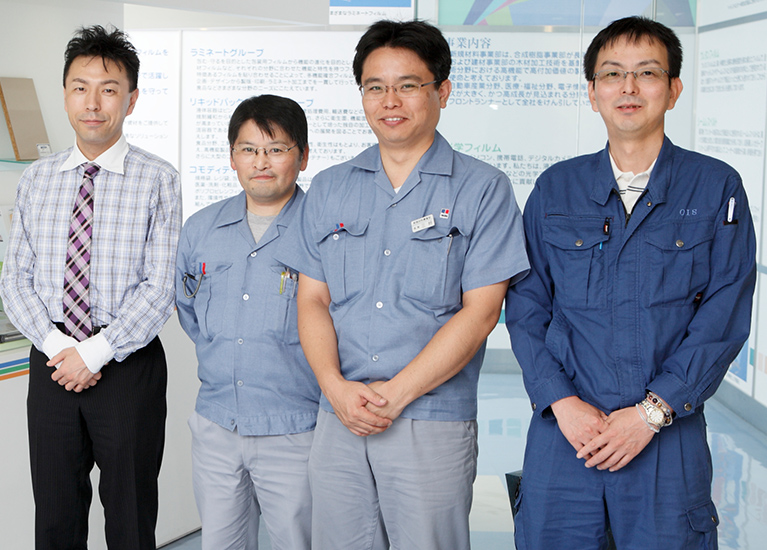
[Photo left] Mr. Hidenori Tanaka, Solutions Dept., Okura Information System Co., Ltd.
[Photo second from the left] Mr. Hiromi Miyoshi, Team chief, No. 3 (Electronic Materials) BU MCSTR, New Materials Div., Okura Industrial Co., Ltd.
[Photo second from the right] Mr. Hiroki Kagawa, Section manager, Solutions Dept., Okura System Information Co., Ltd.
[Photo right] Mr. Shinichi Kozai, Section manager, System & Engineering Support G, Business Support Dept., New Materials Div., Okura Industrial Co., Ltd.

Mr. Miyoshi
Okura Industrial was established soon after the war, in July 1947. Its business consists of three pillars, the main business which is synthetic resins for manufacturing packing/wrapping plastic films, with the other two being new materials and building materials. It has seven factories in Japan and one in China with 14 business offices in Japan and its group companies amounting to 20.
“Sales were increasing steadily; however, we didn’t give much importance to the control of the volume of inventory. Eventually, we had to review our inventory control as we reached a point where the increased inventory was becoming a problem” reflects Mr. Hiromi Miyoshi, the team chief of No. 3 (Electronic Materials) BU MCSTR, New Materials Div.
In those days, inventory control was entrusted to the people in charge of production control; therefore, the volume of inventory was adjusted according to their ability. For example, there were cases in which an excessive inventory of raw materials for optical films for cell phones, with a demand with sharp fluctuations, became dead stock as a result of misjudging its lifecycle.

Mr. Kozai
“From around 2006, customers demands on quality and price started becoming more stringent as the industry became excessively competitive. In the division, we also started holding in-house training courses as we decided to reform the business with the sense of crisis.” (Mr. Miyoshi)
The people in charge of production control continued to gather periodically for improvement activities even after the training courses were finished.
One of the problems that became apparent from these discussions was the “mismatch between information and actual goods”: the volume of inventory on the information system and actual volume of inventory were different. Furthermore, the inventory data was stored in the core system, and its visualization was challenging.
“We were in a state where checking the inventory transition as data was difficult” explains Mr. Miyoshi.
It was highly probable that it would be too late when slow moving inventory was identified. A method for maintaining appropriate inventory without depending on people was urgently needed.
In 2010, Mr. Shinichi Kozai, section manager of System & Engineering Support G, Business Support Dept., New Materials Div. first built and installed a system to record actual production in factories to make information match the actual goods. And then he decided to look for a solution to visualize the inventory as the next step. One requirement was to clearly show the transition of not only individual items, but also that of each category as well as the whole picture for an inventory including thousands of items.
One immediate candidate was a BI tool. Mr. Kozai ordered a leading product and used it on a trial basis.
“Grasping the total volume of inventory was easy. However, since it offered no way to know which item had excess inventory, using it for single-item control was unrealistic as each item had to be checked individually in order, requiring much time to view and check. So, we started looking for software capable of showing the inventory transition of individual items in a speedy and easy-to-understand way.” looks back Mr. Kozai.

Mr. Kagawa
While repeatedly looking for a solution, they discovered “SynCAS PSI Visualizer” provided by Hitachi Solutions East Japan at an exhibition.
“It allowed for roughly grasping slow moving inventory by department or category, as well as drilling down to individual inventories in the case of a doubt. Moreover, its speedy response was a perfect match to the solution we were looking for. It was love at first sight because we sensed that it could also be applied to the raw material inventory” speaks Mr. Kozai appreciatively of “SynCAS PSI Visualizer”.
They discovered “SynCAS PSI Visualizer” in October 2009 and from the next month, they started full-scale examination aimed at its introduction. In 2010, Mr. Hiroki Kagawa, Section manager of Solutions Div., Okura Information System Co., Ltd., a group company, was already attending the product training at Hitachi Solutions East Japan Tokyo Business Office.

Mr. Tanaka
“I brought sample data with me and realized that the system would be immediately utilized as management tool. After returning to the company, I started sorting out issues in connection with its implementation, such as its linkage with the core system.” says Mr. Kagawa.
Thereafter, the study for its implementation was interrupted for about six months due to company-internal circumstances but later resumed, gaining speed in November 2010.
“We decided to implemente it in three steps to allow a soft landing for users” says Mr. Hidenori Tanaka.

The design for data linkage with the core system started in November 2010, and by January of the next year 2011, the daily volume of inventory was available in “SynCAS PSI Visualizer” for checking.
“This had a huge impact on the people in charge of production control. The volume of inventory, which until then was available only inside their heads, was available as a graph clearly understandable to everybody at a glance. For outsiders, it meant “visualization” but for insiders, it meant “exposure”. So, they started working more seriously to keep the appropriate inventory level”. (Mr. Miyoshi)
The second step started operation in March 2011. The actual production data and actual sales data on the core system were made available in “SynCAS PSI Visualizer” so that they could be visualized along with the inventory data, enabling assessment whether or not the volume of inventory was appropriate based on actual sales.
In the third step, which started operation in April 2011, the received order data and planned sales data were added. As a result of linking volume of inventory with planned production and planned sales, it became possible to keep appropriate inventory by taking future outlook into consideration.
“We started with the first step in January, but in March, just after two months, we already saw some reduction in our inventory. This June will be our sixth month with the solution, but we have reduced the inventory by about 20%” speaks Mr. Miyoshi as the results of implementing “SynCAS PSI Visualizer”.

The inventory has been reduced by 20%, but the Production Control Section aims for inventory turnover. Due to the short lifecycle of the product,they consider inventory turnover is more important than the volume of inventory.
“Currently, we are about to reach our target inventory turnover” says Mr. Miyoshi.
Mr. Kozai, who led the implementation of the system, Is in charge of checking for excess inventory.
“I’m currently in charge of checking inventory across divisions, but eventually, we’ll need to have an organization or staff member dedicated to inventory control” says Mr. Kozai.
Mr. Kozai points out that an organization or staff member dedicated to inventory control is necessary to benefit from the implementation of “SynCAS PSI Visualizer”. Furthermore, he is considering implementation of reorder point control, MRP, and scheduler to reduce the workload related to checking. In addition,
he says as an advice “in our case, I believe that one of the factors for success was that the inventory data linkage from the core system was relatively simple. For the implementation of “SynCAS PSI Visualizer” to be smooth, people with detailed knowledge on the core system data structure are necessary.”
Both Mr. Kozai and Mr. Miyoshi point out that “the volume of inventory is a reflection of an organization’s true strengths”. The interest of the management tends to be data directly related to performance expansion such as the sales situation. However, in Okura Industrial, the top management has promoted “maximum sales, minimum cost” at every opportunity. Such a background pushed the division to work on inventory adjustment, Which “SynCAS PSI Visualizer” helped to achieve brilliantly.

|
Company Name |
Okura Industrial Co., Ltd. |
|---|---|
|
Established |
July 11, 1947 |
|
Head Office |
1515 Nakazu-cho, Marugame, Kagawa, 763-8508 Japan |
|
Paid-in Capital |
8.6 billion yen (as of December 31, 2016) |
|
Number of Group Employees |
1,980 (as of December 31, 2016) |
All of us at Okura Industrial aim to have a force for good. We strive to achieve this through the Three Ps: package, protect, and progress. Specifically, we hope to achieve that goal through packaging products that provide a dash of color to people’s lifestyles; through products that are considerate of the environment and help protect the earth’s natural beauty, and innovation in performance materials that help spark further progress in state-of-the-art technologies. Not only are the Three Ps a succinct description of our business activities, they are also an indication of the ways in which we seek to make life more comfortable for the people of the world. They are values that we are proud to present to society.