What is important for inventory management / inventory reduction is to quickly find and solve the problem inventory (over stock, bad stock, eccentrically located stock, out of stock, etc.). However, if inventory management is done with a table like the one on the right, finding the problem stock becomes extremely difficult as the number of products increases.
This issue can be solved by using SynCAS PSI Visualizer. There are two reasons.
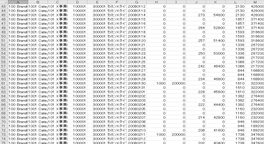
SynCAS PSI Visualizer can display the stock transition in a graph rather than a numerical value. As a result, you can quickly discover if there is a problem in the stock transition "visually" as shown above.
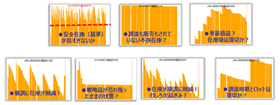
Moreover, SynCAS PSI Visualizer also has the function to notice the occurrence of problem inventory by alert. It will notify you by changing the color when a problem occurs, if you define and set problem type and its criteria preliminary.
Since there is a detection function for problems, you are enabled to be always aware of problem inventories and work on it.
So You do not need to take a reactive approach to problems any more, and the inventory management operation becomes more efficient.
Preliminary diagnosis can also be done!
What is the flow to introduction? Learn more
We will send you introduction materials to know more about the product! Learn more