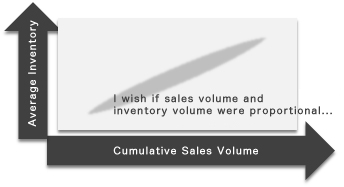
It is very difficult to grasp how much the inventory reduction of all products has progressed, when inventory management is performed with a table like the right figure. It will take a lot of troublesome work to grasp the progress only by numerical value.
This issue can be solved by using SynCAS PSI Visualizer. There are two reasons.
SynCAS PSI Visualizer can graphically display the average inventory quantity and cumulative sales quantity, like the above figure. Therefore, you can instantly grasp the balance between the inventory quantity and sales quantity, and confirm how much inventory reduction has been performed.
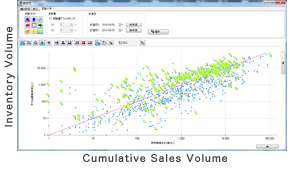
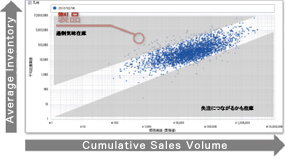
SynCAS PSI Visualizer enables you to confirm the inventory quantity and sales quantity of all products compared to last year, as shown above (In the above figure, green is the movement direction since last year, and blue is this year). You can see that from the inventory movement since last year (green),the inventory of this year (blue) has become a little balanced. You can confirm the progress to inventory reduction in this way.
As shown above, you can grasp the present state of inventory reduction, and moreover confirm the progress condition of inventory reduction compared with last year. Since the proportional state of sales quantity and inventory quantity is the ideal, you will be able to check the progress and judge what should be done towards the ideal.
Preliminary diagnosis can also be done!
What is the flow to introduction? Learn more
We will send you introduction materials to know more about the product! Learn more