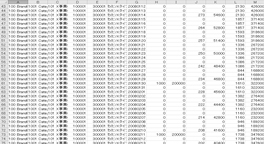
In inventory management, there are many cases using spreadsheet software as shown on the right. However, when using spreadsheet software, as the number of products increases, it becomes a table with only numerical values, making it difficult to instantly grasp what is wrong.
This issue can be solved by using SynCAS PSI Visualizer. There are two reasons.
SynCAS PSI Visualizer can visualize the inventory status based on the inventory management table (the above image is a sample) you are using now. Therefore, you can visualize the inventory even though the number of products is large, grasp the inventory status of all products, and discover the problem.
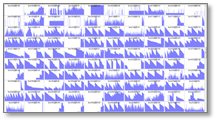
SynCAS PSI Visualizer visualizes the inventory transition of all products as shown above, even though the amount of products is large. Therefore, you can grasp the inventory transition of all products in a moment, and easily perform inventory reduction / inventory management.
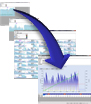
In this way, you can instantly visualize (view graphically) the inventory management table filled with numerical values.
Therefore, you can efficiently perform inventory management / inventory reduction to all products, even if the number of products is large.
Preliminary diagnosis can also be done!
What is the flow to introduction? Learn more
We will send you introduction materials to know more about the product! Learn more