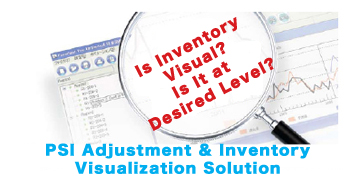
"SynCAS PSI Visualizer" is a system developed for the Retail and Manufacturing Industry to "Visualize" inventory management, and realize "Visualization of Inventory", "Early Detection of Problem Inventory", "Visualization of Inventory Adjustment Progress", etc.
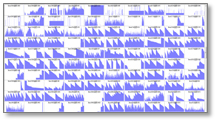
The first feature is the "Visualization of Inventory Transition". Even though the number of products (number of SKU) is large, the inventory transition of all products can be visualized as described above. Inventory management can be managed much more efficiently than managing only by numerical values.
The second feature is the "Drill down from total inventory to each product (SKU unit)". Arbitrary group such as "Inventory by Warehouse", "Inventory by District", "Inventory by Product Group" can be set from all inventory, and drilled down to product unit. Maximum of 15 levels can be set, and confirmation of inventory transition by detailed grouping can be done by one click.
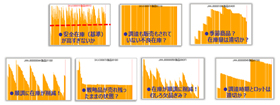
The third feature is the "Visualization of Problem Inventory". The inventory transition of all products is visualized; therefore, when there is a problem, it can be discovered by one glance. Inventory having problems such as "Isn't the standard of safety stock high?", "Isn't the purchase excessive, or the sales slowing down?", etc. can be discovered by "one glance".
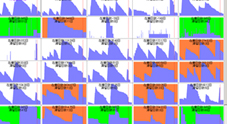
The fourth feature is the alert function to "Notify the Occurrence of Problem Inventory. By "Defining and setting the criteria of problem occurrence" preliminary, the state as problem inventory will be notified with an alert by changing the color as described above.
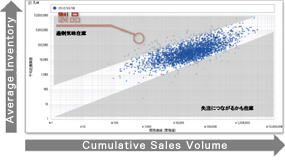
The fifth feature is the "Visualization of the Balance between Inventory and Sales of All Products". As shown above, a scatter diagram for each product with the average stock quantity and cumulative sales quantity of all products as the axis can be displayed; therefore, either over stock trend or out shortage trend can be grasped in a moment.
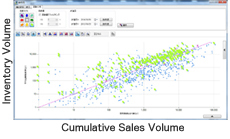
The sixth feature is the "Visualization of Progress to Inventory Optimization". It compares the scatter diagram of last year and the scatter chart of this year at the same time, and instantly grasps whether it is moving to the proper balance overall.

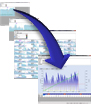
The last feature is the "Output of PSI Information". Since graphs and PSI information can be output, workload for document creation will dramatically be reducad. Just process the output material for the meeting.
These are the features of SynCAS PSI Visualizer.
It is a system that greatly improves your inventory optimization operation, and improves inventory optimization.
Preliminary diagnosis can also be done!
What is the flow to introduction? Learn more
We will send you introduction materials
to know more about the product! Learn more